
In our previous article, we talked about how important Google Analytics 4 (GA4) is in today’s digital marketing landscape and its key difference from Universal Analytics (UA). In this article, we will explore GA4 even further and cover the basics of navigating around the platform, the data it provides, and how you can use it to your advantage.
Using GA4’s Demo Account To Learn And Explore
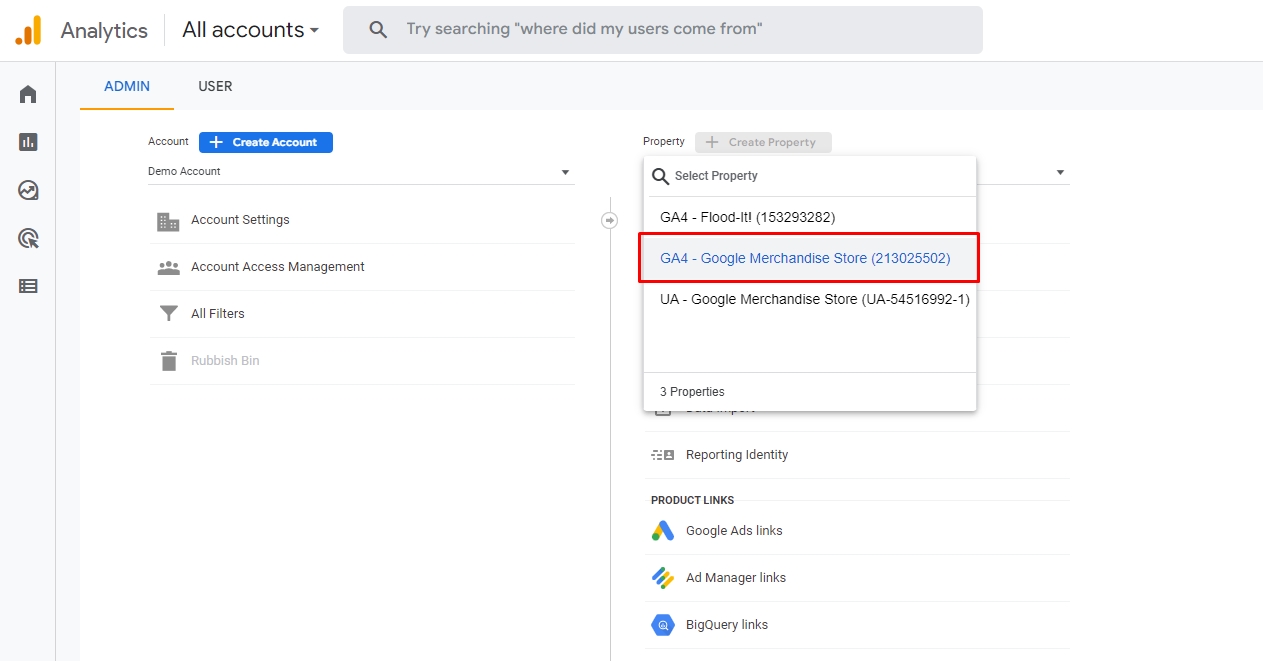
Using data from other accounts that have already implemented GA4 can help you understand the data and how to use it best. Although it’s ideal to have a website with a functional GA4 implementation, this isn’t realistic for everyone.
Remember the Demo Account we used to familiarise ourselves with UA? They have it for GA4 now too! You can use this to get a feel of how the analytics software works and you can feel free to explore the different settings. You can’t use this account for your own business as the demo account is based on Google’s merchandise shop. Still, it’s a great way to experiment with the software and learn about the various features it has to offer.
If you haven’t set up your GA4 property yet, take some time to explore these resources and get a much better feeling for how GA4 works and what data to expect when you set up Google Analytics 4.
Custom Reports
In UA, you have access to limited and often not-very-comprehensive custom dashboards. In GA4, you get access to Explorations (formerly Analysis Hub), which enables you to create custom reports with a much more advanced level of customization and build capabilities that you just can’t get access to in UA.
Explorations allow you to create tables, visualisations, or reports to better understand cohorts, paths, funnels, or segments. You can share the report with specific people, print it as a PDF, or download it as an Excel workbook.
In simpler terms, you can create any kind of report based on the data you want to see instead of the limited dashboard available in UA.
Creating Segments To Filter An Audience View Without Needing To Save Them
In UA, to filter an audience, you need to create and save a segment before applying it to almost all reports in the interface. However, in GA4, segments only apply to a single report (and its sub-tabs) of the Explore section. You can then easily create additional audience segments without having to save them. If you wish to reuse the same segment in a new Explore report, you just need to recreate the segment.
This can be easily done using the comparisons tool available on every reporting page, which allows you to quickly and easily create audience segments based on specific factors.
3 Types of Segments
You will come across 3 options when you begin creating a new custom segment: user, session and event.
In UA, there were two options: user and session segments. Now, we finally have the third option: the event segment. So what do these segments actually mean?
- User Segment – a segment that will include all events of users if they meet certain criteria.
- Session Segment – will include all events but only of those sessions that match the criteria.
- Event Segment – will show only particular events that meet the criteria.
Creating segments
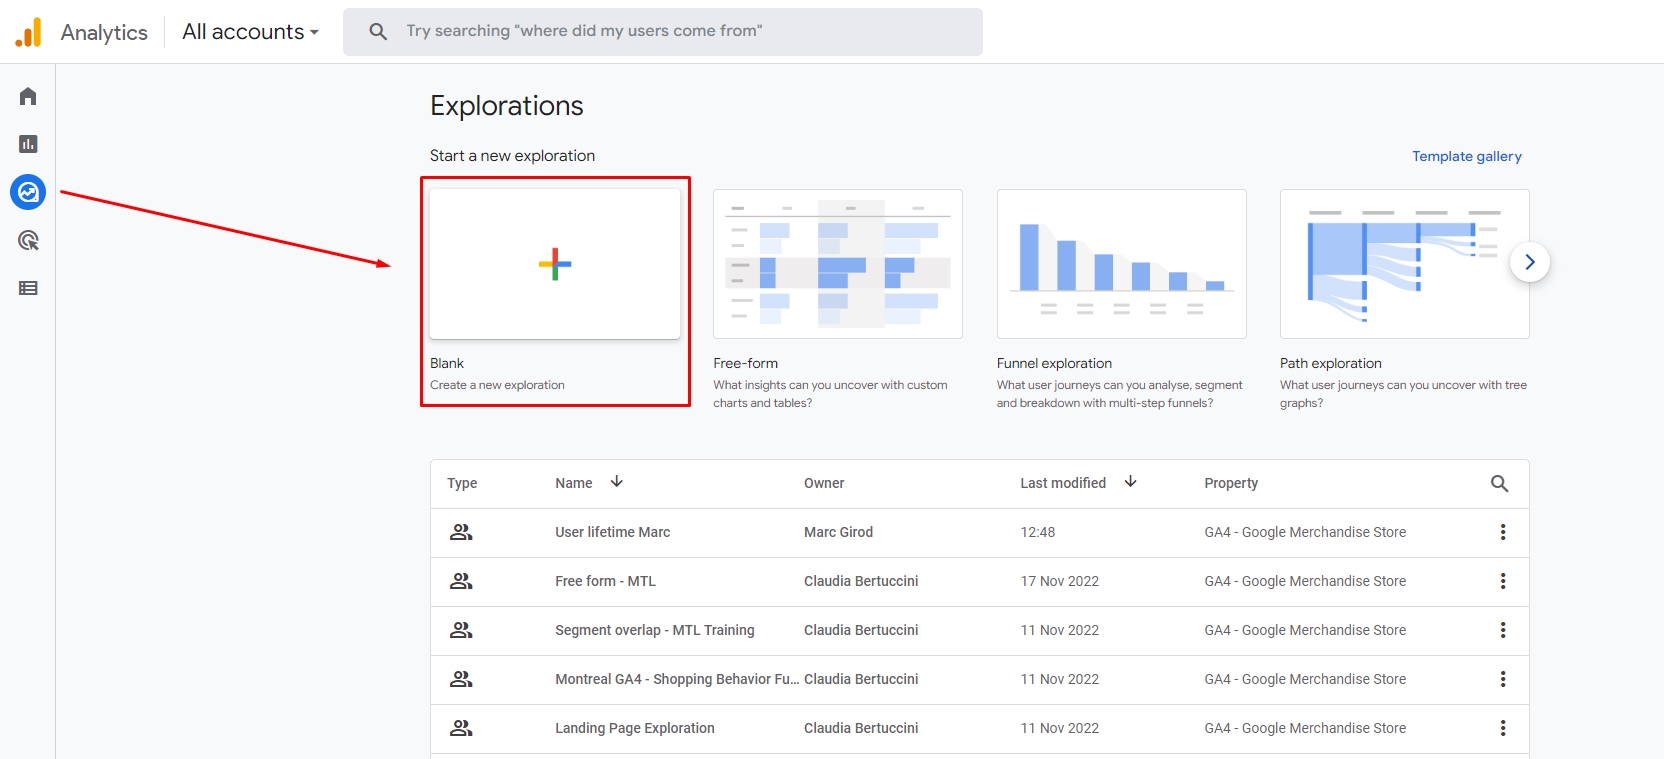
Step 1: Click on “Explore” in the left sidebar.
Step 2: Select “Free-form” for your custom report.
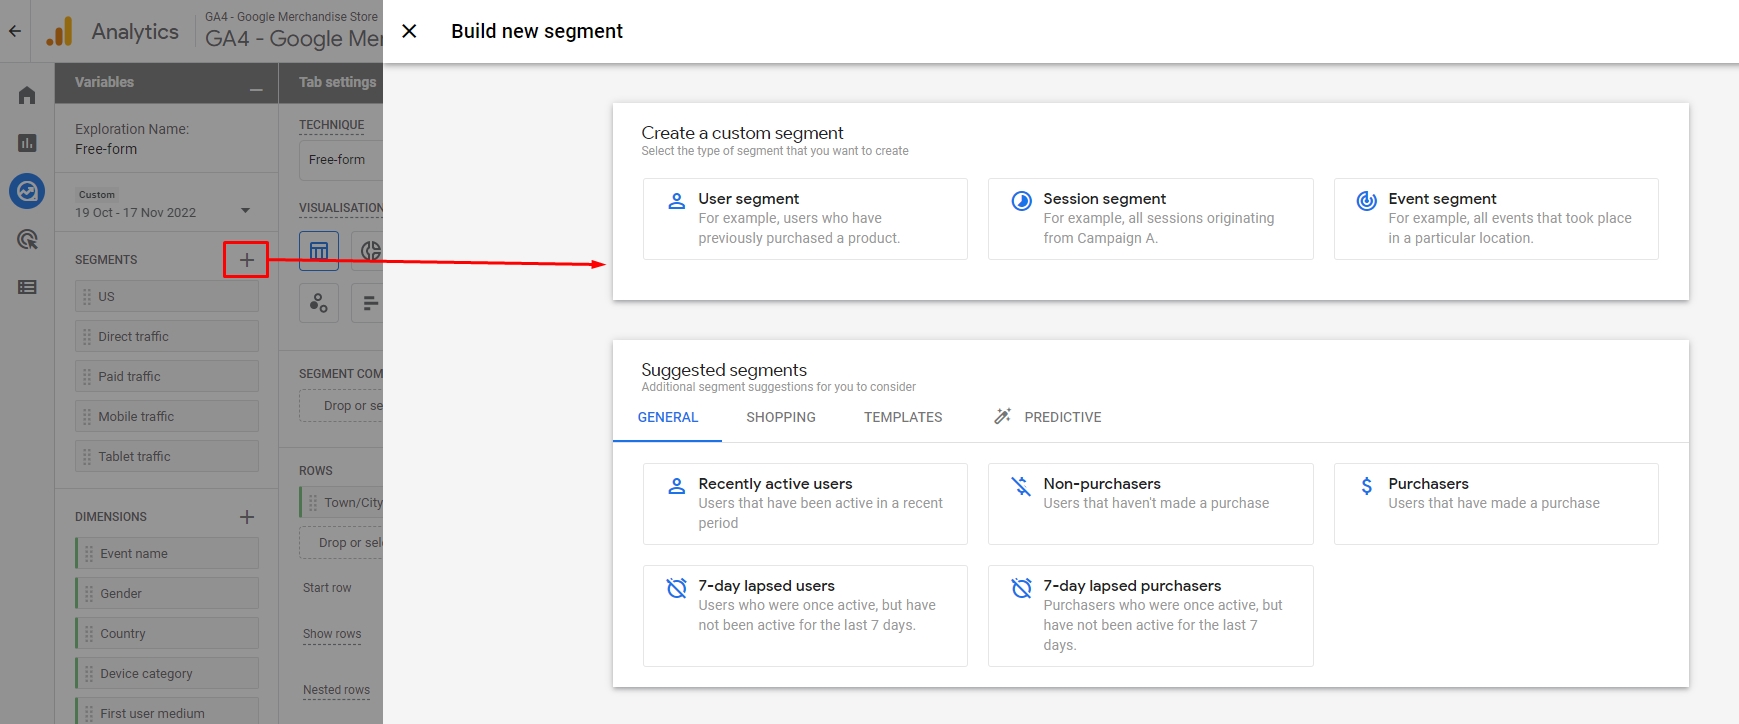
Step 3: Click on the “plus” icon in the segments block.
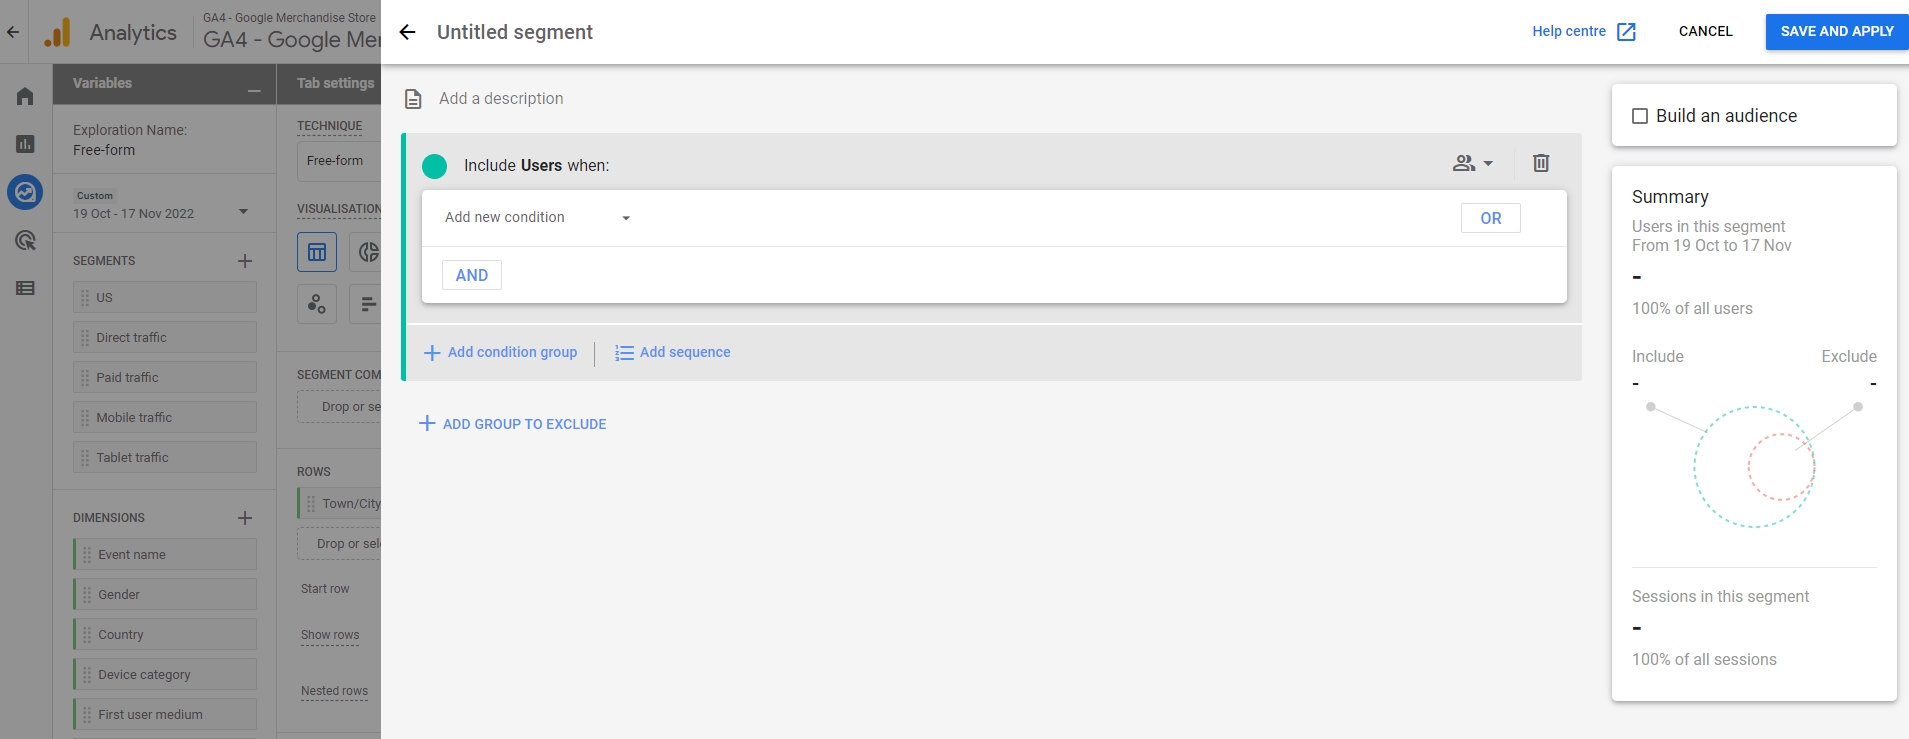
There are 3 types of information you can fill in:
- Define the conditions for the segment.
- Create an audience from the segment (or not).
- Review the part of your data that relates to the segment.
Step 4: Choose either “Custom” or “Suggested” segment.
Step 5: Fill in segment details.
If you want to create a permanent audience segment, you can do so on the Configuration screen or by creating a segment in “Explorations”.
4. Bounce Rate Metric Is Back, But Is It Still Important?
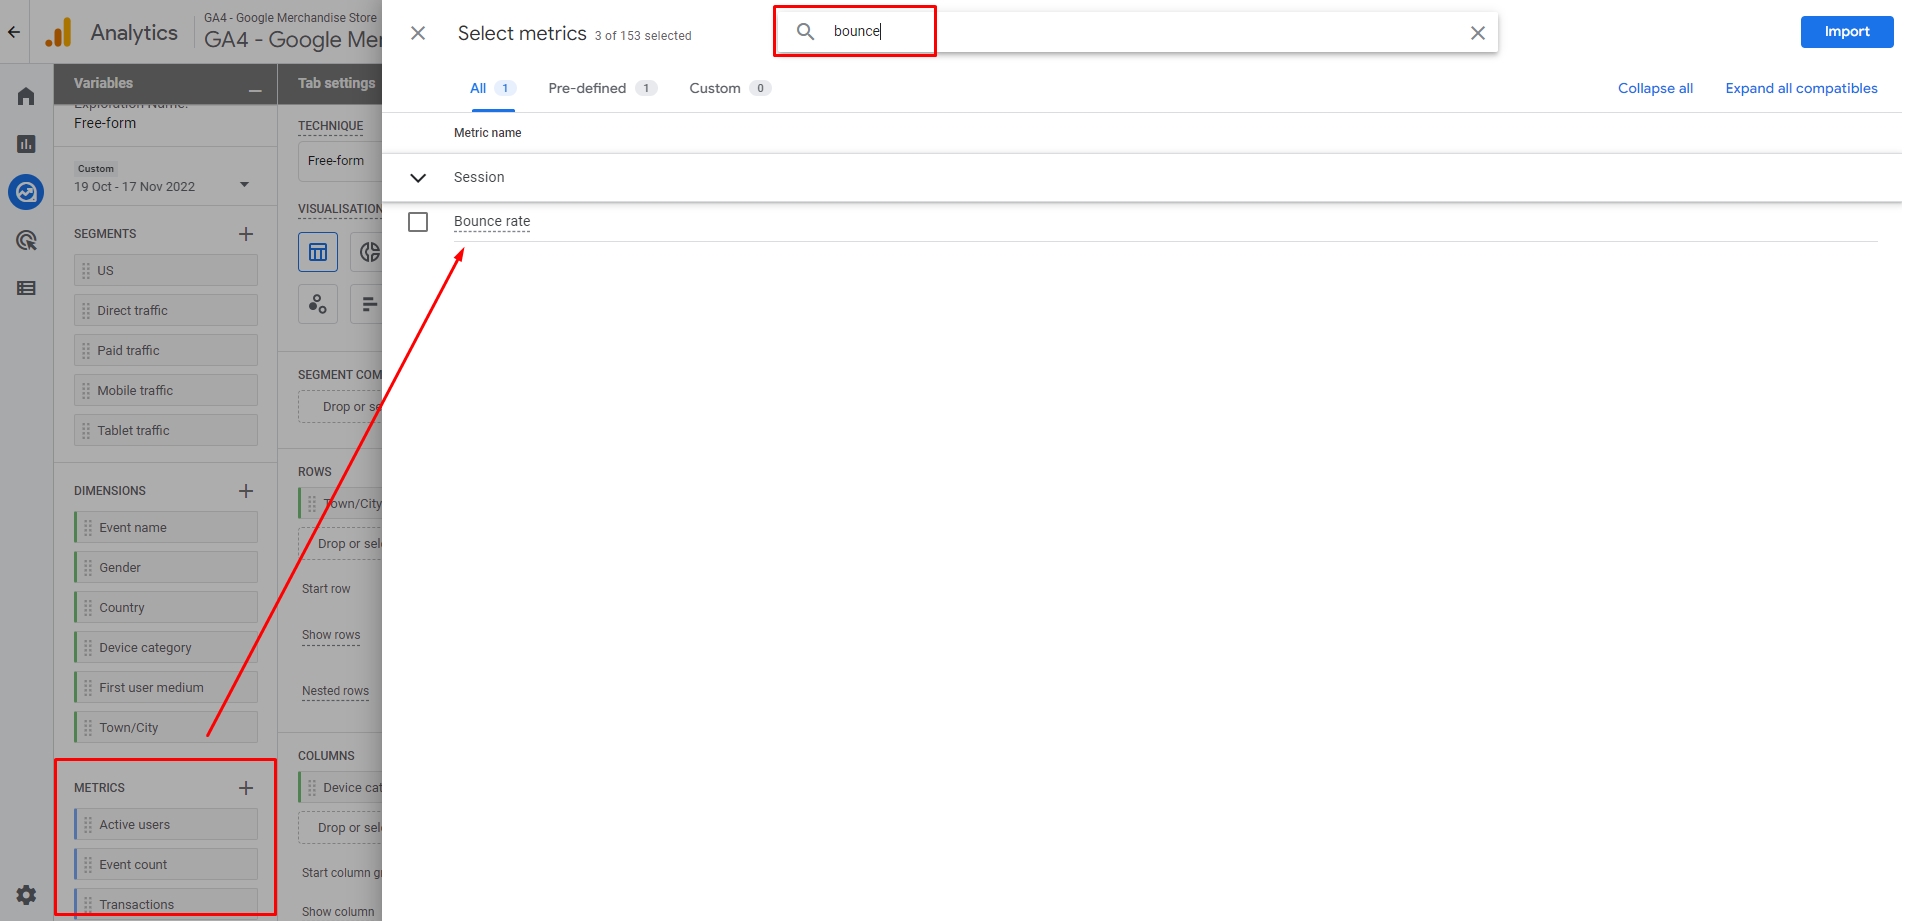
Google Analytics recently added the new Bounce Rate metric. You may be familiar with the term Bounce Rate in User Analytics, which is defined as a user leaving without clicking on any links or triggering any events being recorded as interaction (even if they stayed on the page for minutes, without clicking on anything).
However, GA4 measures bounce differently. The GA4 metric measures bounce rate as the number of people who looked at a page, did not trigger any events or interactions, and left within ten seconds. An engaged session is counted in GA4 when the user triggers an event, or when a session lasts for 10 seconds or more. With that said, the bounce in GA4 can be seen as a “non-engagement rate” metric by many, as it can lead you to focus on the negative trait.
In GA4 case, it can be useful to think of bounce rate as the opposite of engagement rate. This can be helpful in focusing our attention on what’s working on our website instead of what’s not working. You might find that a combination of engagement rate and bounce rate is more useful than merely focusing on bounces, depending on the analysis you are performing.
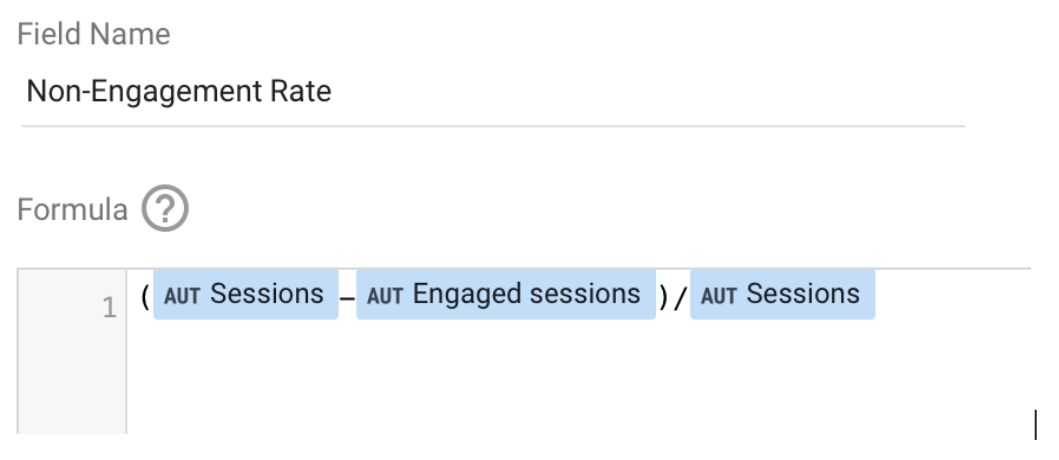
How to create your own bounce rate metric
As it would take some time for the new bounce rate implementation to be rolled out to GA4, you can workaround and create your own ‘bounce rate’ metric using data from Google Analytics currently. You can calculate this metric by dividing the number of non-engaged sessions by the total number of sessions. Here’s the formula you can use in Google Data Studio:
5. DebugView For Troubleshooting
One of the most welcome additions to Google Analytics 4 introduces a debug view, and it’s sure to be a feature you use often. This GA4 tool lets you see real-time firing data using the website. This is a great way to check if your data is firing correctly and if there are any issues with your website.
DebugView allows you to track incoming events from a specific device or browser for troubleshooting and debugging. After enabling debug mode on your specific device, you can use the GA4 navigation panel to view events from the specific device or browser.
Enabling DeBugView on a browser or a device
There are 3 ways to enable DeBugView for your website. You can enable the GA debugger Chrome extension, use Google Tag Manager’s preview mode, or send a debug_mode parameter along with an event.
.clickr-table{border:none; border-collapse:collapse;}
.clickr-table td{vertical-align:top; padding:10px;border:2px solid #000; text-align:center;}
| Using the Chrome extension | Using GTM Preview mode | Setting up a custom parameter in GTM |
| Downloading of chrome extension here. Install the extension and click to activate.
|
Use GA4 with Google Tag Manager to use preview and debug mode.
GTM preview mode adds a parameter to Analytics to show data from the browser on the chosen device in the debug view. |
Add “debug_mode” to the GA4 configuration tag in GTM. Set it to “true” (no quotes).
Analytics will then send this data to your debug view. |
Once you have the debug mode enabled using one of the options above, you can begin your testing.
How to use DebugView
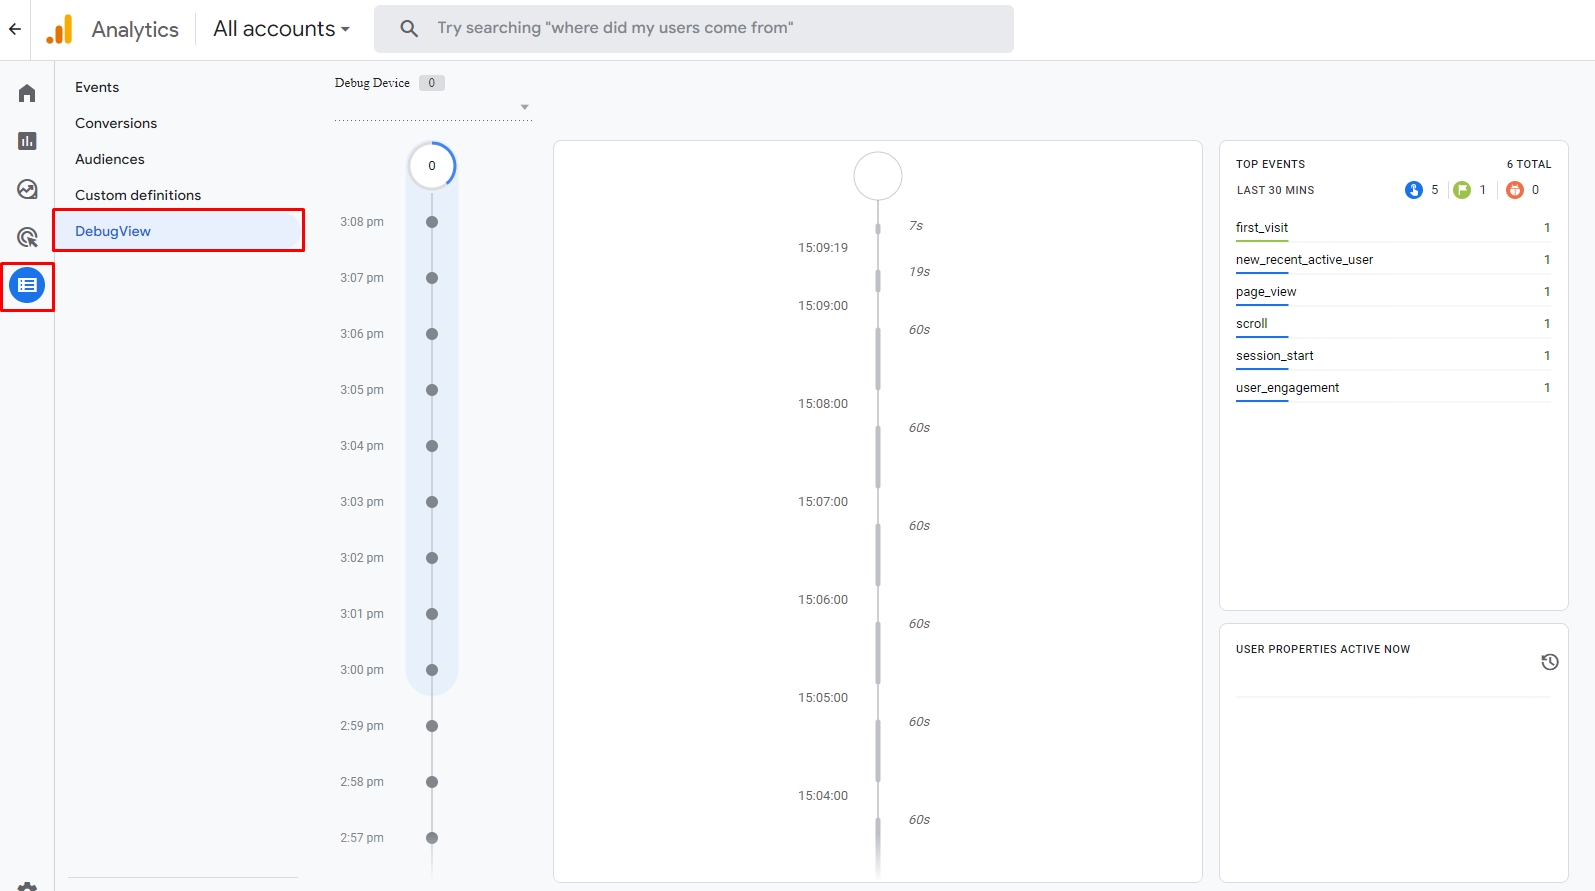
- Click on “Configure” then “DebugView”,
- The leftmost column has each circle representing the last 30 minutes.
- The number inside the circle shows how many events were counted that minute. Clicking on one of the circles will show you the events recorded that minute. You can see these events in detail.
- The middle column shows each event, with a timestamp of when it was triggered. If you click on the event, you get a list of the parameters.
- The top right of the app shows your top events. These are the most popular events in the last 30 minutes. Click on these events to see the timestamps of the parameters sent with the event.
- On the bottom right, you can see the user properties. They show the current user properties for the selected device currently running in debug mode. Click on the clock icon to see changes over the past 30 minutes.
- Finally, the device selector on the top lets you select which enabled device data you want to run through debug mode.
Conclusion
We hope that this article has been an insightful and helpful guide to understanding GA4 and its features better. If you have any suggestions or feedback, please share them with us. We hope that you’ve enjoyed this article and that you’ll continue to enjoy our site!